Introduction
Some platforms have little room for slow responses. Online gaming and entertainment services keep thousands of people connected at once, process payments, and update live information every second. When a large event starts, traffic can rise within minutes. If something breaks at that moment, users notice immediately, and they often share their frustration just as fast.
The teams behind these platforms face a common question: how quickly can we tell that something is wrong, and how well can we explain why? This ability is called observability. It is the practice of collecting enough information from your systems, such as measurements, event records, and request paths, so that engineers can understand what is happening inside them without guessing.
An observability maturity model describes how this ability grows over time. It helps a team see where it stands today and what to improve next. This article explains the stages of such a model, the signals worth collecting, how to build alerts people can trust, and how to turn the findings into a realistic plan. It is written in plain language for engineers, managers, and technology leaders, with no code.
Monitoring and Observability: What Is the Difference?
The two words are often used as if they mean the same thing, but they answer different questions.
- Monitoring tells you that something is wrong. For example, error rates are high.
- Observability helps you find out why. For example, one payment service slows down only when a particular database is busy.
Monitoring is a part of observability. A team that only monitors can raise an alarm. A team with strong observability can also trace the cause, often much faster.
The Three Kinds of Signals
Most observability work relies on three kinds of information.
Metrics are numbers measured over time, such as requests per second, error rate, and response time. They are cheap to store and good for spotting trends and raising alerts.
Logs are written records of events, such as “payment request failed.” They hold detail, but they can become large and noisy.
Traces follow one request as it passes through many services. They show where time is spent and where a failure begins. In systems made of many small services, traces are often the fastest way to find the source of a delay.
None of these is enough alone. Metrics tell you where to look, traces show the path, and logs give the detail.
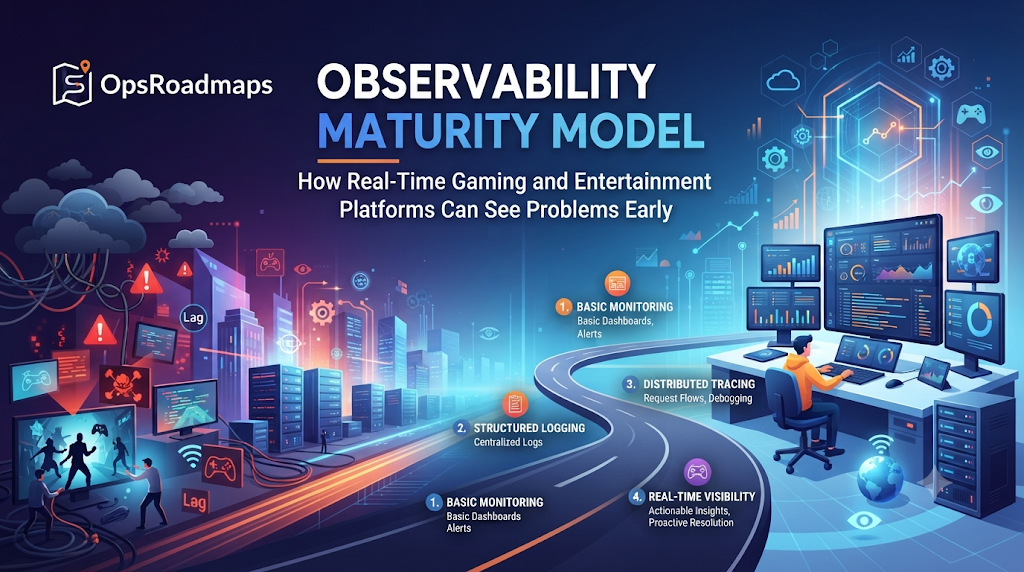
An Illustrative Maturity Ladder
The ladder below is a general teaching tool. It is not the official scoring of any platform, and real frameworks use their own levels and rules. Always read how a framework defines its stages.
| Stage | What it looks like | Typical warning sign |
|---|---|---|
| 1. Reactive | Problems are found when users complain | Support tickets are the first alarm |
| 2. Basic monitoring | Servers and services have simple health checks | Alerts say “something is down” but not why |
| 3. Service-aware | Each service has metrics, logs, and a named owner | Teams see their own service but not the full journey |
| 4. User-centered | Targets and alerts reflect what users actually experience | Alerts still need manual investigation across tools |
| 5. Proactive | Traces connect services, trends predict trouble, and reviews drive change | The risk is complexity and rising cost, not blindness |
Most teams move through these stages in order, and some parts of a system may sit at different stages than others. A team can be strong in one service and weak in another.
Seven Questions to Test Your Current Stage
You can place your team on the ladder with a few honest questions. Look for evidence, not opinions.
- Can we tell within minutes when users are affected? Evidence: alert history that shows early detection.
- Do we know which service caused a problem, not just that a problem exists? Evidence: recent incident notes that name the cause.
- Can we follow one user action across all the services it touches? Evidence: a trace for a real request.
- Are our alerts mostly useful? Evidence: the share of alerts that led to action.
- Does every important service have an owner? Evidence: an ownership list that is current.
- Do we know what normal looks like at our busiest times? Evidence: saved views of past peak periods.
- Do we learn from each incident? Evidence: review notes and a list of agreed changes.
Questions you cannot answer with evidence point to the gaps worth fixing first.
Building Alerts People Trust
Alerts are the place where observability meets human attention, and poor alerts do harm. A team that gets constant false alarms soon learns to ignore them, which means a real problem may be missed.
Good alerts follow a few principles:
- Alert on user impact. A sustained rise in failed requests matters more than one busy server.
- Include context. An alert should say what is affected, how badly, and where to look first.
- Attach a next step. Link each alert to a short runbook.
- Review regularly. Remove alerts that no one acts on and add missing ones after incidents.
Runbooks should also cover well-known technical problems. For example, a team running containers on Kubernetes should have a documented approach to Kubernetes CrashLoopBackOff troubleshooting. This status means a container keeps starting and failing again. A good alert will notice repeated restarts early, and the runbook will tell the responder to read the status, events, and previous logs first, and to ask for approval before any step that changes production.
Preparing for Peak Traffic
Platforms with live events need to plan for sudden demand. Observability helps in three ways.
Before the peak: Review what happened during earlier busy periods. Check capacity and confirm that alerts, dashboards, and the on-call schedule are ready.
During the peak: Use one shared view so everyone reads the same data. Watch the user-facing measures first, such as failed requests and response times, then look deeper only if they change.
After the peak: Hold a blameless review. Record what went well, what was close to failing, and what to change.
A broader production readiness assessment before a major launch can confirm that these basics are in place. It can also show gaps in areas such as recovery and ownership.
Handling Sensitive Data in Logs
Platforms that process payments and personal details must be careful about what they record. Logs and traces can accidentally capture passwords, payment details, or personal information. This turns a helpful tool into a security risk.
Sensible habits include:
- Decide which fields must never be recorded, and enforce that rule.
- Mask or remove sensitive values before records are stored.
- Limit who can read logs, and review that access regularly.
- Set retention periods so data is not kept longer than needed.
These steps belong in any DevSecOps implementation roadmap, because security works best when it is part of everyday engineering. If your business is regulated, follow the rules of your licensing authority. A self-assessment can support your preparation, but it does not prove compliance.
The Cost of Seeing Everything
Collecting more data is not always better. Logs and traces can grow into a large bill, and the volume can bury the information you need.
A balanced approach asks:
- Which signals do we use in decisions or alerts?
- Which data can be sampled instead of kept in full?
- How long does each type of data need to be stored?
- Who owns the observability budget?
A cloud cost optimization roadmap often includes these questions. The goal is useful visibility, not maximum volume.
Turning Your Stage into a Plan
Knowing your stage is only the start. A helpful plan follows the five steps below:
- Assess the current state. Gather evidence for the seven questions above.
- Find the gaps. Note where evidence is missing.
- Set priorities. Rank gaps by user impact, risk, effort, and dependencies.
- Plan the work. Give each action an owner, a date, and a way to check success.
- Review regularly. Revisit the plan as the platform and traffic change.
Dependencies decide the order. You need basic metrics before you can set meaningful targets. You need ownership before alerts can reach the right person. You need alerts that work before you can improve incident response.
Larger programs can build on this foundation. An SRE adoption roadmap adds reliability targets and error budgets. A platform engineering adoption roadmap gives teams shared tools so that every service does not build its own monitoring setup.
A Hypothetical Example
Picture a team running a live-event platform. On a busy evening, users report slow loading, but the team’s dashboard shows all servers as healthy. This puts them at Stage 2 of the ladder, with monitoring but little explanation. The team adds request tracing across its main services and discovers that a payment-check service becomes slow when traffic spikes. They create an alert based on user impact, write a runbook, and agree on an owner. At the next busy event, they notice the slowdown within minutes and respond using the runbook.
Nothing about this guarantees a perfect night. It simply shows how clearer visibility and ownership shorten the time between a problem and a response. This progress also feeds an incident management maturity model, which measures how well a team prepares for and learns from incidents.
What a Maturity Assessment Can and Cannot Do
A self-assessment reflects what your team reports and can prove. It is not an independent audit, a formal certification, or a promise of compliance. It is best used as a guide for planning. If your sector requires formal reviews, those are a separate step.
Where OpsRoadmaps Fits
OpsRoadmaps is an engineering operations assessment and improvement platform. According to its published description, it offers a free operational health scan that needs no account, along with more detailed production readiness and reliability assessments for signed-in users. It uses published, versioned scoring rules with explainable results, and it keeps a clear line between self-reported maturity and independent audits. Its library includes observability improvement frameworks, checklists, and runbooks that teams can use alongside the steps in this article. A wider DevOps maturity assessment can show how observability connects to delivery, security, and incident response.
Common Mistakes
- Buying tools before agreeing on questions. Tools do not decide what matters.
- Alerting on everything. Noise hides real problems.
- Recording sensitive data. Logs can become a security risk.
- Ignoring cost. Unlimited data can strain budgets.
- Forgetting ownership. A dashboard with no owner goes stale.
- Treating the model as a score to win. The goal is better decisions, not a higher number.
FAQs
1. What does an observability maturity model measure?
It describes how well a team can detect, understand, and explain what happens inside its systems, and how that ability grows.
2. Is observability only for large platforms?
No. Smaller teams benefit too, often with simpler tools and fewer signals.
3. Do we need all three signals from the start?
Not usually. Many teams begin with metrics and alerts, then add logs and traces as needs grow.
4. How do we know if our alerts are good?
Check how many led to action, how often they were false alarms, and whether real incidents were caught early.
5. How often should we review our stage?
Review after major launches, after serious incidents, and on a regular schedule such as every few months.
6. Can better observability prevent outages?
It cannot prevent all of them. It helps teams detect problems sooner, understand them faster, and learn from them.
7. Who should own observability?
Each service team should own its own signals, with shared standards and support from a platform or reliability group.
Conclusion
For platforms that serve people in real time, the speed of understanding often matters as much as the speed of fixing. An observability maturity model gives teams a clear way to see where they stand, decide what to improve next, and measure progress honestly. Start with evidence, build alerts that people trust, protect sensitive data, and keep cost in view. Then review the results often. Over time, steady and well-ordered improvements will do more than any single tool.
